PyTolosa Features
PyTolosa Features
Section titled “PyTolosa Features”PyTolosa is a Python package that enables post-treatment of one-dimensional and two-dimensional Tolosa generated data. It reads 1D and 2D data from .csv and .bin files respectively, and uses the matplotlib library to create various plots.
1D Outputs
Section titled “1D Outputs”The one dimensional data can be post-treated if it is stored in a .csv file. PyTolosa reads those files and creates plots showing the time evolution of the fields extracted.
Typical 1D Applications
Section titled “Typical 1D Applications”- Time series at gauge points - Monitor water levels, velocities at specific locations
- Cross-section profiles - Analyze flow characteristics across river sections
- Discharge evolution - Track flow rates over time
- Water level variations - Study tidal or flood variations
Example 1D Output
Section titled “Example 1D Output”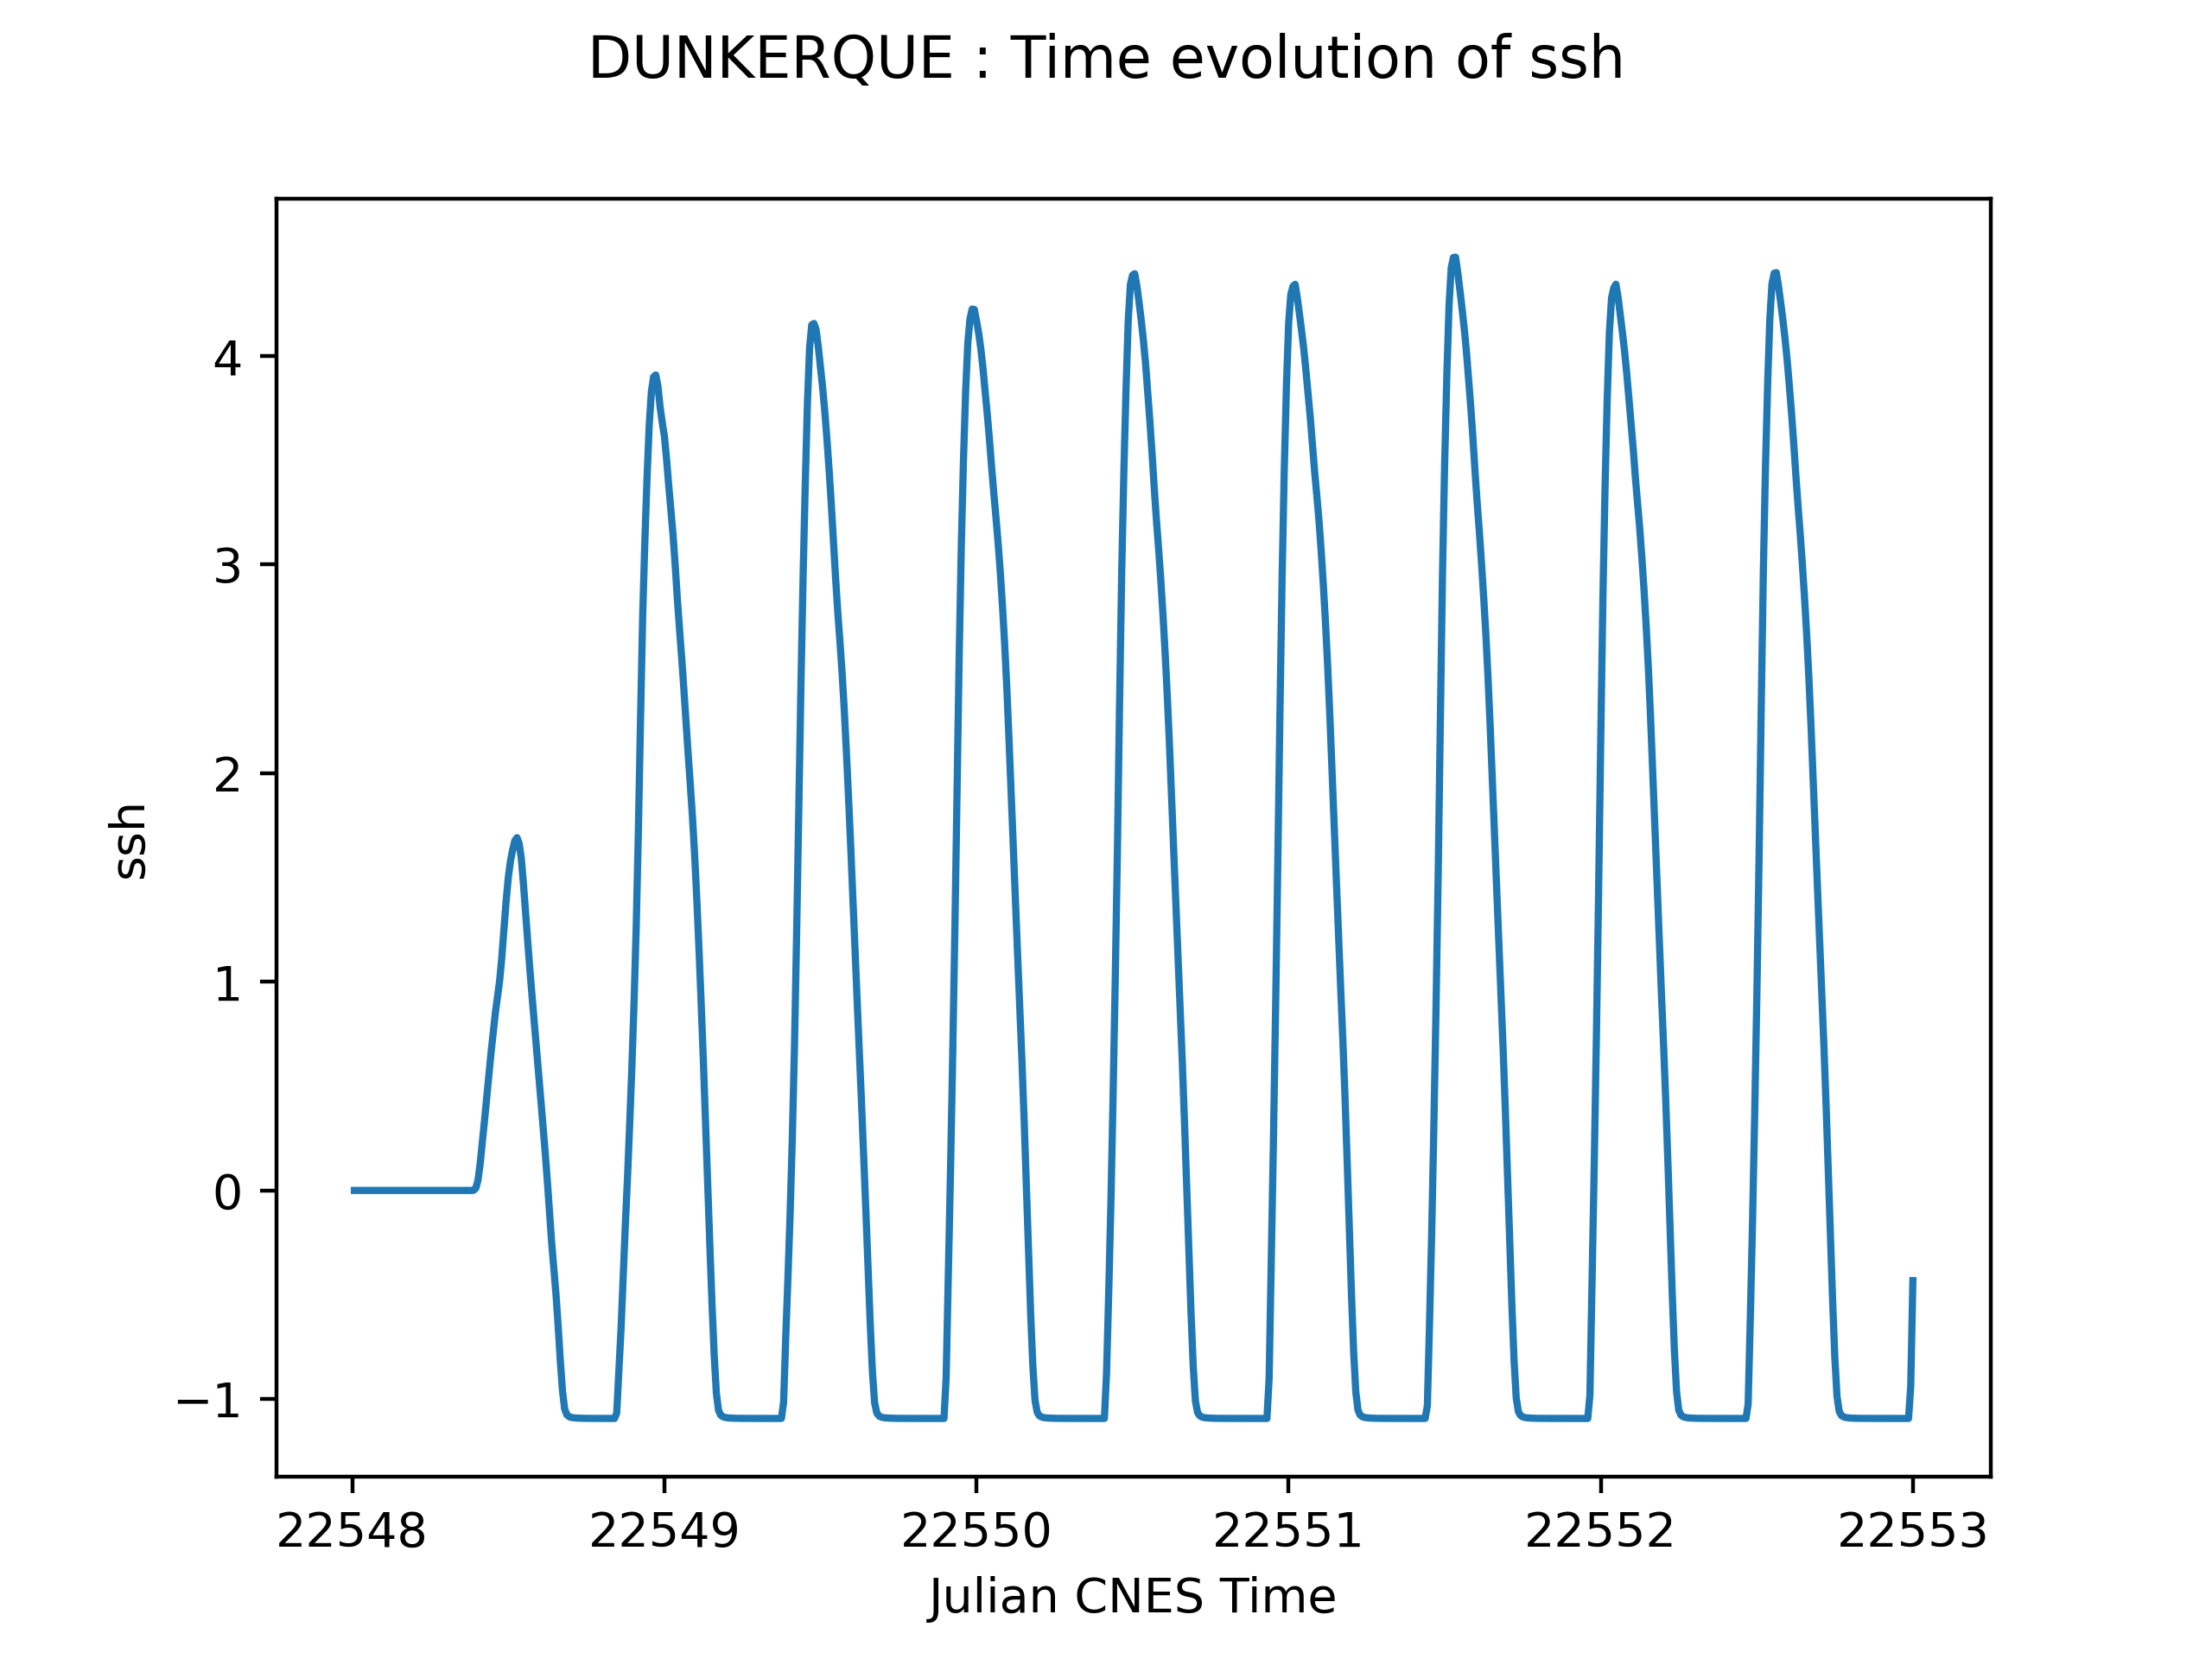
2D Outputs
Section titled “2D Outputs”The two dimensional data can be post-treated if it is stored in .bin files. These files each represent the state of the domain at each output time step.
Binary File Structure
Section titled “Binary File Structure”One binary file contains:
-
A key to define the content of the binary file
Key Meaning key = 0No date and no min/max values written key = 1No date, but min/max values written for each field key = 2Date written, but no min/max values key = 3Date and min/max values written -
The date (if
key = 2or3): written in seconds, Gregorian date, and Julian CNES date -
The minimum and maximum values of the fields extracted (if
key = 1or3) -
The field values at each cell center
Available Fields
Section titled “Available Fields”The fields that can be extracted and read by PyTolosa are:
- Sea surface height (
ssh) - Free surface elevation above reference - Total water depth (
h) - Full water column height - Bathymetry (
bathy) - Bottom topography - Horizontal velocity (
u) - Velocity in x-direction - Vertical velocity (
v) - Velocity in y-direction
Animation Creation
Section titled “Animation Creation”PyTolosa post-treats binary files by creating an animation of the fields distribution on the domain.
To do this, PyTolosa needs to read:
- A binary mesh file containing the mesh connectivity
- The time-series binary files (one for each time step)
PyTolosa then creates an animation in the directory containing those files.
Advanced Features
Section titled “Advanced Features”Display Window Control
Section titled “Display Window Control”Change the display window: Zoom on a certain subdomain by specifying the window coordinates:
- Longitude/Latitude coordinates - For georeferenced data
- Stereo x/y coordinates - For Cartesian grids
Field Scaling
Section titled “Field Scaling”Rescale field values: Adjust the colorbar and define new field scales to better visualize specific ranges of values.
Animation Settings
Section titled “Animation Settings”Customize animations with:
- Extension - Output format (mp4, avi, gif, etc.)
- Frame rate - Frames per second (fps)
- Image size - Number of horizontal pixels
- Colormap - Choose from matplotlib colormaps (see colormap reference)
- Image resolution - DPI (dots per inch) for high-quality output
Browsing Mode
Section titled “Browsing Mode”PyTolosa can explore your working directory to search for 1D and/or 2D cases and post-treat them automatically.
Activate this option by adding -all when running PyTolosa. This is useful for:
- Processing multiple simulation outputs in batch
- Automating post-processing workflows
- Comparing multiple cases
Parallel Processing
Section titled “Parallel Processing”PyTolosa supports parallel post-processing using MPI:
mpirun -np 4 python3 -m pytolosa [options]This is particularly useful for:
- Processing large datasets
- Creating high-resolution animations
- Handling multiple time steps efficiently
Output Examples
Section titled “Output Examples”1D Time Series Plot
Section titled “1D Time Series Plot”- Line plots with time on x-axis
- Multiple variables on same plot
- Legend and grid
- High-resolution PNG/PDF output
2D Animation
Section titled “2D Animation”- Smooth time evolution
- Customizable colormap
- Domain boundaries
- Time stamp overlay
- Multiple file formats (MP4, AVI, GIF)
2D Static Plots
Section titled “2D Static Plots”- Snapshot at specific time
- Multiple fields side-by-side
- Vector field overlays (u, v components)
- Contour lines
Next Steps
Section titled “Next Steps”- Running PyTolosa - Learn how to use these features
- Presentation - Overview of PyTolosa